Once an application is deployed to production, ensuring its reliability and availability becomes essential. This is especially true for modern applications that are distributed, built with microservices, and deployed using container platforms like Docker and Kubernetes.
Health checks are a key part of keeping these applications running smoothly. They help you know if your application and the things it relies on.
What are Health Checks?
Health checks are diagnostic tools that monitor the status of an application and its dependencies such as databases, external APIs, or message queues. Their purpose is to determine whether each component is functioning correctly and ready to handle incoming requests. They provide a quick snapshot of the application’s health, allowing monitoring tools and orchestration platforms to make informed decisions, such as restarting an unhealthy container or redirecting traffic away from a failing instance.
There are three main statuses a health check can return:
- Healthy: The application and its dependencies are working as expected.
- Degraded: The application is running but experiencing minor issues or performance degradation. It might still be functional, but not optimally.
- Unhealthy: The application or a critical dependency is not working, and it requires immediate attention.
Setting Up Health Checks in .NET
The .NET health check middleware is part of the Microsoft.AspNetCore.Diagnostics.HealthChecks NuGet package. It provides a flexible and extensible framework for defining health checks and exposing them via HTTP endpoints.
Step 1: Install Required NuGet Packages
To get started with health checks, you need to add the main health check package to your project. This package provides the basic features for monitoring your application’s health.
dotnet add package Microsoft.AspNetCore.Diagnostics.HealthChecks
Once you have the main health check package, you might want to check the health of specific parts of your application. For specific needs, like checking a SQL Server database, MySQL database, MongoDB, or Redis cache, you’ll need to install extra packages. For example:
dotnet add package AspNetCore.HealthChecks.SqlServer
dotnet add package AspNetCore.HealthChecks.MySql
dotnet add package AspNetCore.HealthChecks.MongoDB
dotnet add package AspNetCore.HealthChecks.Redis
These packages provide pre-built health checks for common services, reducing the need for custom implementations.
Step 2: Setting up simple, default health check
To enable basic health checks, you typically add the following in your Program.cs file (or Startup.cs in older .NET versions):
// Program.cs
var builder = WebApplication.CreateBuilder(args);

// Add health checks services
builder.Services.AddHealthChecks();

var app = builder.Build();

// Map health check endpoint
app.MapHealthChecks("/healthz");

app.Run();
builder.Services.AddHealthChecks(); adds the basic health check system to your application. It enables the ability to perform health checks, but doesn’t define what to check yet. It’s like setting up the framework for health monitoring.
app.MapHealthChecks(“/healthz”); then creates a special web address, or endpoint. When something or someone visits this address, the application will run its health checks and report back if everything is working correctly. The /healthz part is just an example; you can choose any name you prefer for this endpoint, like /status or /app-health. This is where the health checks become accessible.
Once you run the application, you can open your web browser and go to localhost:port/healthz (or whatever path you chose) to see the health check results.

We have already mentioned that these are the possible options:
| Status | Description |
|---|---|
| Healthy | The application is functioning normally. |
| Degraded | The application is running but may have performance issues (e.g., a slow external API). |
| Unhealthy | The application is failing and may need intervention. |
Custom Health Checks
The default health check only confirms that the app is running. In real-world scenarios, you need to verify more than just checking if the app is running. Other checks might included:
- Database connectivity
- External API availability
- Disk space/memory usage
- Third-party service status
In this example let us add a check for a MySql database. To perform a health check on a specific service, like a MySQL database, you need to install a dedicated NuGet package. For MySQL, you would use:
dotnet add package AspNetCore.HealthChecks.MySql
After installing this package, you’ll need to configure the check within your application’s setup. This involves adding specific lines of code to tell the health check system how to connect to and verify your MySQL database.
builder.Services.AddHealthChecks()
    .AddMySql(
        connectionString: builder.Configuration.GetConnectionString("MySqlConnection"),
        name: "mysql-server-check",
        failureStatus: HealthStatus.Unhealthy,
        timeout: TimeSpan.FromSeconds(3),
        tags: new[] { "database", "critical" });
Now, if you run the application again, and since the connection string I provided is correct, you will see the following response:

You can also add more than one on same configuration section. lets say we want to have both MySQL and also Redis, well in that can you just add after the AddMySql the AddRedis method and looks like below
You can also add more than one health check within the same configuration section. For example, if you want to check both MySQL and Redis, you can simply add the AddRedis method right after the AddMySql method. Before doing so, you’ll need to install an additional NuGet package to use the AddRedis method.
dotnet add package AspNetCore.HealthChecks.Redis
The updated code would look like this:
builder.Services.AddHealthChecks()
    .AddMySql(
        connectionString: builder.Configuration.GetConnectionString("MySqlConnection"),
        name: "mysql-server-check",
        failureStatus: HealthStatus.Unhealthy,
        timeout: TimeSpan.FromSeconds(3),
        tags: new[] { "database", "critical" })
    .AddRedis(
        redisConnectionString: builder.Configuration.GetConnectionString("InvalidRedisConnection"),
        name: "redis-cache-check",
        failureStatus: HealthStatus.Unhealthy,
        tags: new[] { "ready", "cache" });
For Redis, I will intentionally provide an invalid connection, but I will provide a valid connection string for the MySQL server check. Then, I will run the application.

Now, the reason why we get Unhealthy here is because even though the mysql connection is healthy the Redis one is not healthy, but as you can see this is not useful at all. What we can do is that we can modify the Formatting Health Check Responses.
Currently, the “Unhealthy” status shows up because even if the MySQL connection is working, the Redis connection is not. However, this general “Unhealthy” status isn’t very helpful for figuring out what’s wrong. To get more useful information, we can change how the health check responses are formatted.
Formatting Health Check Responses
By default, the /healthz endpoint (which you can name anything you like) provides very little information. To get a more detailed output, such as JSON that can be used for dashboards, you can use HealthCheckOptions. I will now replace the existing code with this new code:
// Configure the health check endpoint
app.MapHealthChecks("/healthz", new HealthCheckOptions
{
    // Customize HTTP status codes for different health statuses
    ResultStatusCodes =
    {
        [HealthStatus.Healthy] = StatusCodes.Status200OK,
        [HealthStatus.Degraded] = StatusCodes.Status200OK,
        [HealthStatus.Unhealthy] = StatusCodes.Status503ServiceUnavailable
    },
    // Custom response writer for detailed JSON output
    ResponseWriter = async (context, report) =>
    {
        context.Response.ContentType = "application/json";
        var response = new
        {
            OverallStatus = report.Status.ToString(),
            TotalDuration = report.TotalDuration.TotalMilliseconds + "ms",
            Checks = report.Entries.Select(e => new
            {
                Name = e.Key,
                Status = e.Value.Status.ToString(),
                Description = e.Value.Description,
                Duration = e.Value.Duration.TotalMilliseconds + "ms",
                Error = e.Value.Exception?.Message
            })
        };
        await context.Response.WriteAsync(JsonSerializer.Serialize(response, new JsonSerializerOptions
        {
            WriteIndented = true
        }));
    }
});
This code sets up the /healthz endpoint to give back more detailed and useful information about your application’s health.
First, it changes the HTTP status codes: if the application is “Healthy” or “Degraded” (meaning it’s working but with some issues), it will send back a 200 OK status. If it’s “Unhealthy,” it will send 503 Service Unavailable.
Second, and more importantly, it customizes the actual message you get back. Instead of a simple “Healthy” or “Unhealthy,” it now creates a JSON response. This JSON includes the overall health status, how long it took to perform the checks, and a list of each individual check. For each check, it shows its name, status, a description, how long it took, and any error messages if something went wrong. This detailed JSON makes it much easier to see exactly what is or isn’t working in your application.
Now, let’s run the app and check the result. The result looks like this:

This detailed output is far more useful for monitoring and troubleshooting. It provides a clear, actionable overview of each component’s status, helping you quickly pinpoint issues. Now, let’s explore how you can go beyond these built-in checks by implementing Custom Health Checks to monitor unique aspects of your application or specific external services not covered by existing packages.
Implementing Custom Health Checks
For scenarios not covered by built-in checks, you can create custom health checks by implementing the IHealthCheck interface. Below is an example of a custom health check that monitors memory usage. Most applications rely on external services like databases, APIs, or message queues. To accurately reflect your application’s health, you need to check the status of these dependencies. You can create custom health checks by implementing the IHealthCheck interface.
This is how a custom health check would look like:
using Microsoft.Extensions.Diagnostics.HealthChecks;

public class MemoryHealthCheck(long maxMemoryBytes = 100_000_000) : IHealthCheck
{
    public Task<HealthCheckResult> CheckHealthAsync(
        HealthCheckContext context, CancellationToken cancellationToken = default)
    {
        var allocatedBytes = GC.GetTotalMemory(false);
        var status = allocatedBytes < maxMemoryBytes ? HealthStatus.Healthy : HealthStatus.Degraded;
        var description = $"Memory usage: {allocatedBytes / 1_000_000} MB (Max: {maxMemoryBytes / 1_000_000} MB)";

        if (status == HealthStatus.Degraded)
        {
            return Task.FromResult(HealthCheckResult.Degraded(description));
        }

        return Task.FromResult(HealthCheckResult.Healthy(description));
    }
}
This code creates a custom health check that monitors your application’s memory usage.
It’s a class called MemoryHealthCheck that checks if the amount of memory your application is using (allocatedBytes) is below a set limit (maxMemoryBytes).
If the memory used is less than the limit, the health check reports as “Healthy.” If it reaches or goes over the limit, it reports as “Degraded,” meaning there might be a problem but the application is still working. The description tells you the current memory usage and the maximum allowed.
Once the custom file is created it needs to be registered in Program.cs (or Startup.cs in older .NET versions):
builder.Services.AddHealthChecks()
    .AddCheck<MemoryHealthCheck>("memory-check", tags: new[] { "ready", "memory" });
or you can add it to the health configuration chain
builder.Services.AddHealthChecks()
    .AddMySql(
        connectionString: builder.Configuration.GetConnectionString("MySqlConnection"),
        name: "mysql-server-check",
        failureStatus: HealthStatus.Unhealthy,
        timeout: TimeSpan.FromSeconds(3),
        tags: new[] { "database", "critical" })
    .AddRedis(
        redisConnectionString: builder.Configuration.GetConnectionString("InvalidRedisConnection"),
        name: "redis-cache-check",
        failureStatus: HealthStatus.Unhealthy,
        tags: new[] { "ready", "cache" })
    .AddCheck<MemoryHealthCheck>("memory-check", tags: new[] { "ready", "memory" });
So, we added the memory-check. Now let us run the app and check the result.

This custom memory health check demonstrates the flexibility to monitor any aspect of your application or its environment, going beyond standard dependency checks. Next, we’ll explore Filtering health checks using tags, which is particularly useful in containerized environments where you often need to
Filtering health checks using tags
In containerized environments, you often need separate endpoints for liveness and readiness probes. Liveness checks ensure the application is running, while readiness checks confirm it can handle traffic (e.g., database connections are established). Use tags to filter checks for specific endpoints. In the configurations above we do have the following tags
“database”, “critical”, “ready”, “cache”, “memory”
These are just examples of names, s feel free to update them as you wish. If you want to filter health checks that have the ready tag, you can do something like this:
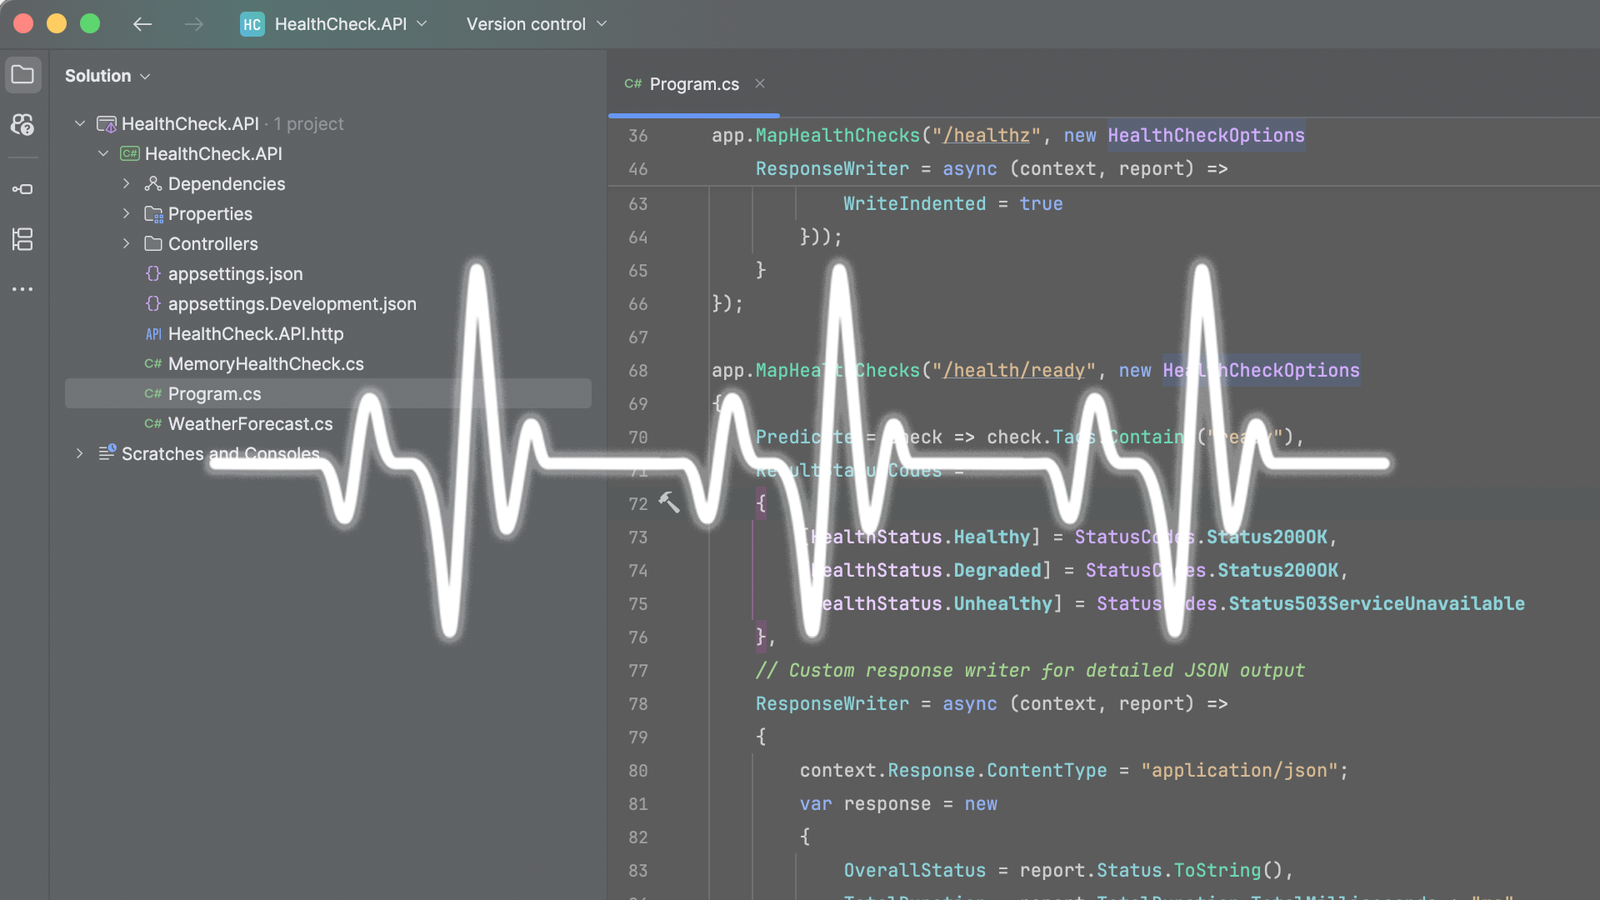
app.MapHealthChecks("/health/ready", new HealthCheckOptions
{
    Predicate = check => check.Tags.Contains("ready"),
    ResultStatusCodes =
    {
        [HealthStatus.Healthy] = StatusCodes.Status200OK,
        [HealthStatus.Degraded] = StatusCodes.Status200OK,
        [HealthStatus.Unhealthy] = StatusCodes.Status503ServiceUnavailable
    },
    // Custom response writer for detailed JSON output
    ResponseWriter = async (context, report) =>
    {
        context.Response.ContentType = "application/json";
        var response = new
        {
            OverallStatus = report.Status.ToString(),
            TotalDuration = report.TotalDuration.TotalMilliseconds + "ms",
            Checks = report.Entries.Select(e => new
            {
                Name = e.Key,
                Status = e.Value.Status.ToString(),
                Duration = e.Value.Duration.TotalMilliseconds + "ms",
                Error = e.Value.Exception?.Message
            })
        };
        await context.Response.WriteAsync(JsonSerializer.Serialize(response, new JsonSerializerOptions
        {
            WriteIndented = true
        }));
    }
});
after I run the app, I need to navigate to /health/ready and I will get the below response

This kind of separation is important because it ensures that you can distinguish between an application that is running but not ready to serve traffic.
Integrating Health Checks with Docker
When running .NET applications in Docker containers, it’s important to let Docker itself monitor whether your app is healthy. Docker supports this through the HEALTHCHECK instruction in your Dockerfile, which periodically runs a command inside the container to verify if the application is alive and responding as expected.
If the check fails repeatedly, Docker marks the container as unhealthy. This status can be used by orchestrators (like Kubernetes, or Azure Container Apps) to restart the container or avoid routing traffic to it.
Below is an example Dockerfile for a .NET application with a health check:
# Build stage
FROM mcr.microsoft.com/dotnet/sdk:8.0 AS build
WORKDIR /source
COPY . .
RUN dotnet restore
RUN dotnet publish -c Release -o /app

# Runtime stage
FROM mcr.microsoft.com/dotnet/aspnet:8.0
WORKDIR /app
COPY --from=build /app .
EXPOSE 8080
ENV ASPNETCORE_URLS=http://+:8080
ENTRYPOINT ["dotnet", "MyApp.dll"]

# Health check
HEALTHCHECK --interval=30s --timeout=5s --start-period=10s --retries=3 \
    CMD curl --fail http://localhost:8080/health || exit 1
This Docker configuration follows a multi-stage approach. The build stage compiles the application using the .NET SDK image, while the runtime stage runs it on a lightweight ASP.NET Core runtime image. Port 8080 is exposed for HTTP traffic. A health check is configured to call the /health endpoint every 30 seconds with a 5-second timeout, allowing a 10-second start period for initialization. If the endpoint fails (non-200 status) after 3 retries, the container is marked unhealthy. The curl –fail command is used for the check, returning a non-zero exit code on failure. Alternatively, you can use a custom script or rely on the application’s internal health check logic.
Conclusion
Implementing health checks in your .NET applications is crucial for building reliable systems. By using the ASP.NET Core health check middleware, you can expose detailed status information via HTTP endpoints, which integrates well with Docker and Kubernetes for automated container management. This practice, combined with Docker’s HEALTHCHECK directive, improves application resilience and fault recovery. Health checks are an easy-to-implement and critical tool for ensuring your containerized applications run optimally, quickly detecting and addressing issues for stable and available services.